Weather synopsis – We begin with a synopsis of the weather situation starting with the map below reflecting the Accumulated Precipitation received during the winter (Nov 1, 2017 to Mar 31, 2018) across the prairies (Figure 1).
 |
| Figure 1. Accumulated precipitation across the Canadian prairies during the winter (November 1, 2017-March 31, 2018. |
Prairie meteorological conditions continue to be cooler and dryer than average. This past week the average temperature was about 1 °C cooler than normal (Fig. 2). The 30-day average temperature (April 6-May 6) was 4 °C cooler than normal (Figs. 3 and 4). Weekly and 30 day total rainfall is approximately 50% less than average (Figs. 5 and 6).
 |
| Figure 2. Average temperatures across the Canadian prairies these past seven days (Apr 29-May 6, 2018). |
|
 |
| Figure 3. Average temperatures across the Canadian prairies these past 30 days (Apr 6-May 6, 2018). |
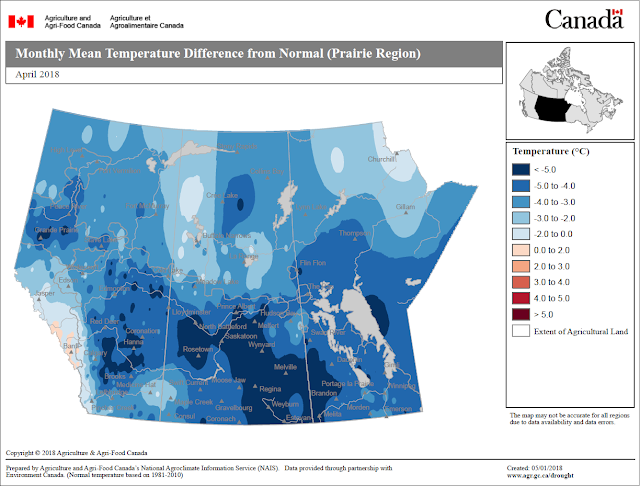 |
| Figure 4. Monthly mean temperature differences across the Canadian prairies for the month of April 2018. |
|
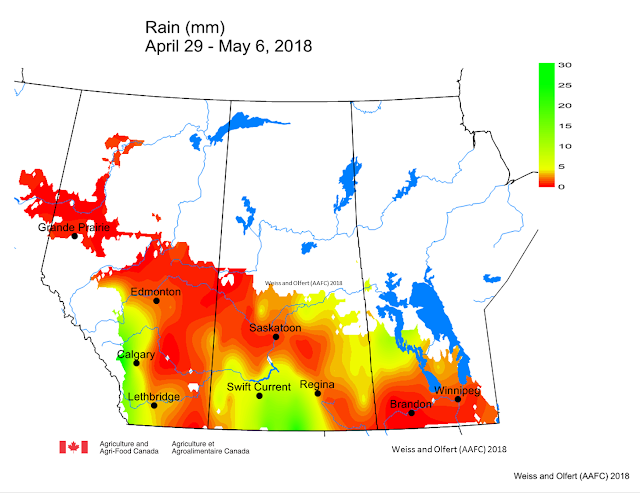 |
Figure 5 Accumulated precipitation across the Canadian prairies these past seven days (Apr 29-May 6, 2018).
|
|
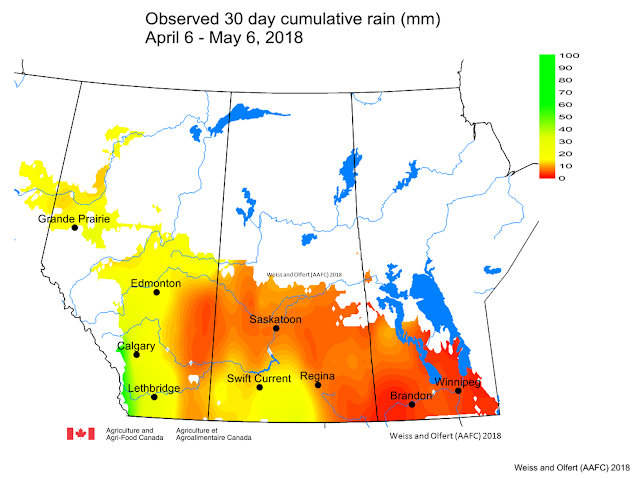 |
| Figure 6. Accumulated precipitation across the Canadian prairies these past 30 days (Apr 6-May 6, 2018). |
The map below reflects the Highest Temperatures occurring over the past 7 days across the prairies.
The map below reflects the Lowest Temperatures occurring over the past 7 days across the prairies.
The growing degree day map (GDD) (Base 10ºC, March 1 – May 6, 2018) is below:
The growing degree day map (GDD) (Base 5ºC, March 1 – May 6, 2018) is below:
The maps above are all produced by Agriculture and Agri-Food Canada. Growers may wish to bookmark the AAFC Drought Watch Maps for the growing season.


